


.jpeg)
Authored by: Gonzalo Rodriguez Del Valle, CFA, SVP Portfolio Management and Investment Strategy Director
How the Elevated Rate Environment Shapes the Future Returns of Fixed Income Portfolios
Executive Summary
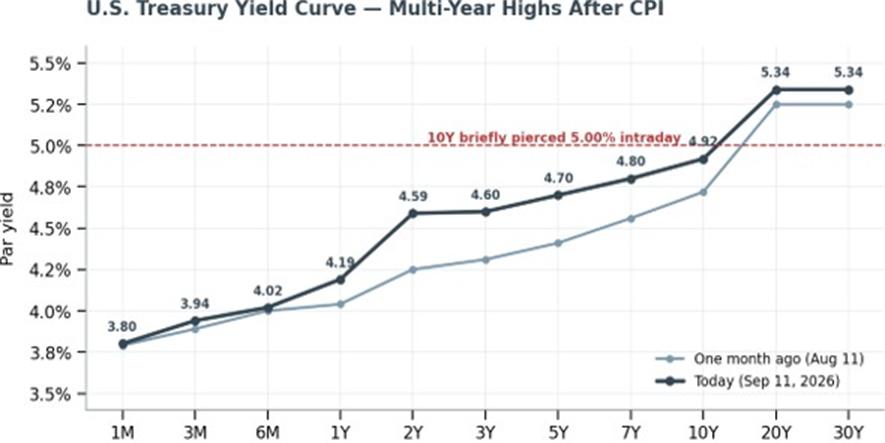
After the most aggressive rate cycle in a generation, the bond market has handed patient investors something it withheld for over a decade: high starting yields. August inflation report reinforced that reality. Consumer prices rose 0.4% on the month and 3.4% over the year, with core inflation accelerating to 0.3% — hotter than expected. The 10-year Treasury briefly pierced 5.00% for the first time since 2024 before settling near 4.9%, and markets now price a Federal Reserve rate hike next week at roughly 90% — what would be the first hike since 2023.
The central message of this paper is unchanged, and in fact strengthened by Friday’s data: in fixed income, the yield you buy today is the single best predictor of the return you earn tomorrow. With yields at multi-year highs and “higher-for-longer” now looking more like “higher-for-longer-still,” the opportunity to lock in durable income has rarely been better. But how that return shows up over the coming years depends on how a portfolio is built. We compare three archetypes advisors encounter every day.
September 11th: August CPI and the Yield Reaction
At 8:30 a.m. ET Friday September 11th, the Bureau of Labor Statistics reported that the Consumer Price Index rose 0.4% in August — its fastest monthly pace since May — leaving the annual rate at 3.4%, unchanged from July but a touch above the 3.3% consensus. Stripping out food and energy, core CPI rose 0.3%, one-tenth hotter than expected and an acceleration from July’s 0.2%. The core annual rate eased to 2.4%.
Energy did the heavy lifting: gasoline jumped 3.9% on the month and accounted for more than a third of the all-items increase, with energy up 16.3% and gasoline up 27.4% over the year amid the ongoing Middle East conflict. More concerning for the Fed, shelter re-accelerated to 0.3%, suggesting price pressure is broadening beyond energy.
%2C%202026..jpg)
The market reaction was a tale of two moves. Immediately after the print, the 10-year yield spiked from 4.94% to just above 5.00% — its first breach since 2024 — and the 30-year touched a 19-year high near 5.38%. As oil prices then fell and cooler heads noted the in-line headline, the long end pared its gains, with the 10-year settling near 4.9%. The policy-sensitive 2-year, however, rose to about 4.59%, because the hot core reading cemented expectations of a Fed hike.

Today’s Market Backdrop
Friday’s data lands on top of a market already defined by higher-for-longer rates, heavy supply, and elevated volatility. Thursday September 10th wholesale inflation (PPI) report showed producer prices up 5.4% year-over-year, and U.S. oil topped $100 a barrel this week. A smaller-than-hoped Treasury buyback added to the selling pressure that had pushed the 30-year to its highest since 2006 and the 10-year within striking distance of 5%.
.jpg)
The Central Insight: Starting Yields Anchor Future Returns
Over nearly five decades, the starting yield of a high-quality bond portfolio has explained roughly 94% of its return over the following five years. The intuition is mechanical: a bond’s return is its coupon income plus or minus price change, and over a multi-year horizon reinvested income dominates. The short-term price swings we are living through — a 10-year that can travel from 4.6% to 5.0% and back in days — tend to wash out as bonds pull to par.
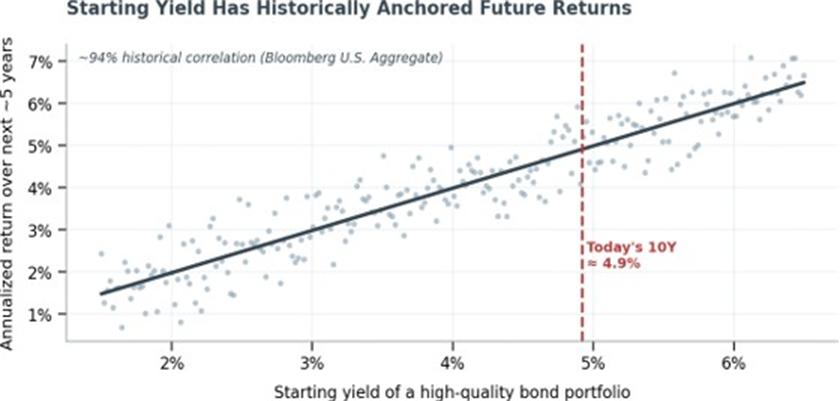
Practically, an investor buying a diversified, high-quality portfolio today near a 5% yield has historically had a strong likelihood of earning a return near that 5% over five years — regardless of the near-term noise. Today’s sticky-inflation, rising-rate backdrop does not undermine that thesis; it extends the window to buy attractive yields, and it means maturing bonds can be reinvested at even higher rates.
Three Portfolios, Three Futures
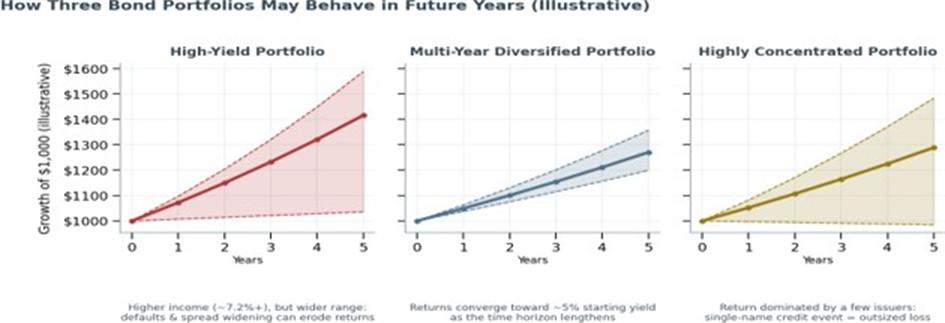
Two investors can start from the same yield environment and end up in very different places depending on how their portfolio is constructed. Exhibit 6 illustrates the range of outcomes — not a forecast — for three common archetypes over the next several years. The shaded band shows the plausible spread of results; the solid line shows a central path.
The High-Yield Portfolio
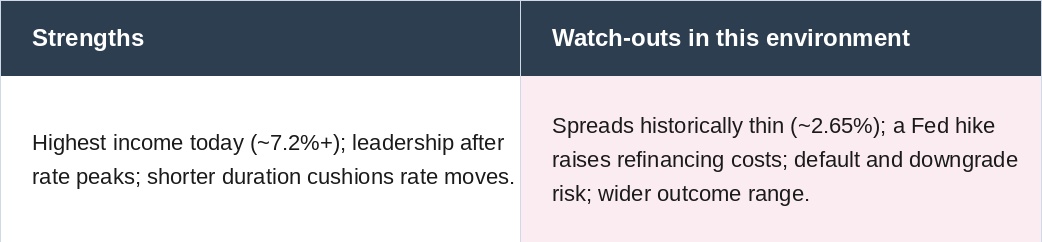
A high-yield (below-investment-grade) portfolio currently offers the richest income — broad indices yield roughly 7.2%. In a stable economy that income compounds attractively, and high-yield has often led fixed income in the years after a rate peak. The catch is what you are being paid for the risk.
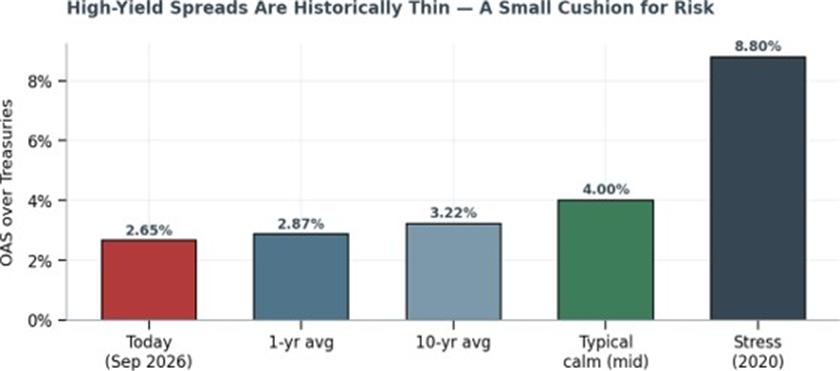
The high-yield spread — the extra yield over Treasuries that compensates for default risk — sits near 2.65%, close to historic lows. Investors are receiving thin compensation for credit risk at exactly the moment the Fed is poised to tighten and the economy faces crosscurrents. If spreads normalize toward their ~3.2% average, or widen in a downturn, price losses and defaults can erode the high headline yield.
The Multi-Year, Diversified Portfolio
This is the archetype today’s environment most favors. By spreading high-quality holdings across a ladder of maturities — and locking in yields near 5% — the multi-year portfolio converts today’s high rates into a durable, predictable income stream. Its range of outcomes is narrow and tightly centered on the starting yield, and it tightens as the horizon lengthens.
Two properties make this design powerful right now. First, reinvestment at high rates: as rungs of the ladder mature, proceeds are reinvested at prevailing yields — so a Fed that keeps rates high, or even hikes, actually helps. Second, diversification and duration: holding many issuers limits damage from any single credit event, while intermediate duration provides ballast if the economy weakens and rates eventually fall — historically, high-quality bonds have delivered positive returns during equity drawdowns.
The Highly Concentrated Portfolio
A concentrated portfolio — a handful of issuers, one sector, or a single large position — places the entire outcome on the fortunes of a few names. When they perform, concentration can outpace a diversified book. But fixed income has an asymmetric risk profile: the best case is getting your coupon and principal back, while the worst case is a permanent, total loss if an issuer defaults. There is no offsetting upside — a bond cannot pay more than its promised cash flows.
That asymmetry is why the concentrated cone in Exhibit 6 has a wide downside tail. A single default or steep downgrade can wipe out years of income across the rest of the portfolio. In an environment where the Fed is tightening and weaker issuers face costlier refinancing, idiosyncratic credit risk is precisely the risk least worth taking uncompensated.
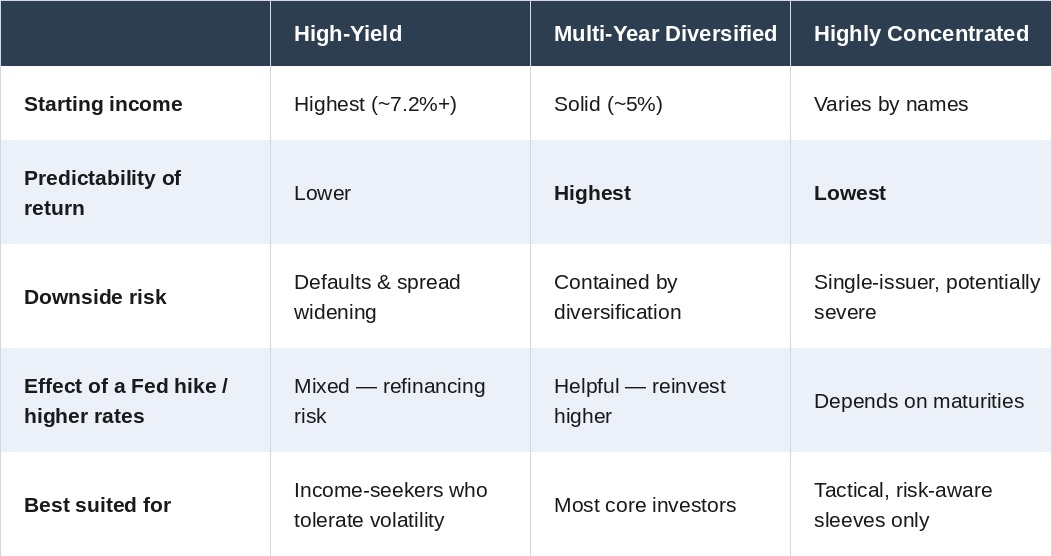
Side-by-Side: What the Next Few Years May Look Like
What This Means for You
Friday’s inflation data and the market’s move toward a Fed hike do not change the playbook — they reinforce it. The environment remains one of the most constructive for bond investors in fifteen years, and it rewards structure over speculation:
• Anchor to yield, not headlines. A ~5% starting yield on a quality portfolio is a strong foundation; a 10-year that touches 5% and pulls back is noise over a multi-year horizon.
• Favor the multi-year, diversified core. Lock in today’s rates across a ladder so maturing bonds reinvest at attractive yields — an advantage if the Fed stays restrictive.
• Use high yield deliberately, not by default. With spreads near record tights and policy tightening, size the allocation to the thin cushion and demand diversification within it.
• Treat concentration as a decision, not an accident. Understand the asymmetric downside — amplified when refinancing gets costlier — and have a plan to diversify.
• Partner with your advisor. Active management — laddering, credit selection, and rebalancing — is how these principles turn into realized returns.
Important Disclosures
Investment products are not insured by the FDIC or by any federal government agency. They are not a deposit or other obligation of, or guaranteed by, City National Bank of Florida or any of its affiliates. They are subject to investment risks, including possible loss of the principal amount invested. They are not a condition to any banking service or activity. City National Private does not provide tax or legal advice.
This material is provided by CNB Wealth Management for educational and informational purposes only and does not constitute investment, legal, or tax advice, nor a recommendation to buy or sell any security or adopt any investment strategy. It reflects market conditions and opinions as of midday September 11, 2026, which are subject to change without notice.
All charts and “growth of $1,000” illustrations are hypothetical, for illustrative purposes only, and are not indicative of the past or future performance of any specific investment or product. Hypothetical scenarios have inherent limitations and do not reflect actual trading, fees, or the impact of financial risk. Past performance is not a guarantee or reliable indicator of future results.
Investing in bonds involves risk, including market, interest-rate, issuer, credit, inflation, and liquidity risk. Bond prices generally fall as interest rates rise, and bonds with longer durations are more sensitive to rate changes. High-yield, lower-rated securities involve greater credit and liquidity risk than higher-rated securities. Concentrated portfolios carry greater issuer-specific risk. Diversification does not ensure a profit or protect against loss. It is not possible to invest directly in an unmanaged index.
Data sources include the U.S. Bureau of Labor Statistics, the U.S. Department of the Treasury, ICE BofA indices via FRED and Macrotrends, CNBC, CBS News, Reuters, and Yahoo Finance, together with the framework of PIMCO’s “Ahead of the Curve” (Q2 2026). Investors should consult their advisor and their own tax and legal counsel before making investment decisions.
Related Posts
.jpg)




.jpg)

The inclusion of any hyperlink does not imply any endorsement, investigation, verification or monitoring by City National Bank of Florida of any information in any hyperlinked site. We encourage you to review their privacy and security policies which may differ from City National Bank of Florida. If you "Proceed", the link will open in a new window.